Creating Your Own OS Zoomstack Tiles
In a past life I worked for the Ordnance Survey, specifically at the Geovation Hub in London working with startups doing interesting things with geospatial tools and data. One thing we experimented with there was Ordnance Survey based Vector Tiles. Since I left the OS has now invested a full open data Vector Tile product called Zoomstack. I thought it was a good chance to give it a whirl!
You can get access to Zoomstack by signing up for the trial. Once you have the trial you will receive an email where you can download the tiles in a variety of formats including a Vector Tile API, GeoPackage, a MBtiles file or a PostGIS dump. The purpose of this post is to produce another format, which is the raw Vector Tiles themselves (protobuf files/ .pbfs). To do this we are going to download the MBTiles file and then run it through a tool called tile-join which comes with Mapbox's tippecanoe. There are probably many other ways we could potentially perform this extraction, and probably even serve them straight from a database directly using a server tool like t-rex or tegola, but in this case will just be creating the raw protobuf files.
Installing tippecanoe and tile-join #
On Mac this is fairly straight forward using Brew:
brew install tippecanoe
On Ubuntu (and flavours) you can get the necessary dependencies, compile and install doing:
sudo apt-get install build-essential libsqlite3-dev zlib1g-dev
make
make install
On Windows this is more complicated but there are some thoughts on doing it on the GitHub issues page for tippecanoe.
To confirm that tile-join is successfully installed, and type:
tile-join
into your command line. You should see a corresponding output with some usage hints. Something like this:
Usage: tile-join [-f] [-i] [-pk] [-pC] [-c joins.csv] [-x exclude ...] -o new.mbtiles source.mbtiles ...
Generating the Vector Tiles #
Now that we know it works, we can use tile-join to generate the necessary files like so:
tile-join --output-to-directory="./tiles" OS-Open-Zoomstack.mbtiles -z14 --no-tile-size-limit --no-tile-compression
You could also remove --no-tile-compression if your web server can support serving gzipped files. This is definitely recommended for production deployments as gzip tiles will be much lighter over the wire, but for local development uncompressed is fine. One last thing; this process might take a little while!
Locally hosting tiles #
Now we are going to host them locally. I chose to use http-server, which you can install using npm (node package manager) like so:
npm install -g http-server
Now http-server should be available as a global command, and we can run it in our tile root directory like so:
http-server --cors
--cors provides us with Cross Origin Resource Sharing support which can be handy if we need to speak from other domains (for example Maputnik). If you did want local gzip compression you could rename all the compressed .pbf files to .pbf.gz with a script and add --gzip as a command flag and http-server should pick them up. You could also add http caching using -c60 (where 60 is the number of seconds) but locally this might cause you some pain if you're trying to change things rapidly.
Now, assuming you were serving tiles from a tiles folder and you called the above command from the root folder contain tiles, you could get at a specific tile like so:
http://127.0.0.1:8080/tiles/14/8128/5494.pbf
Try opening that in your browser (Chrome, Firefox etc) to prove that it works!
Plugging it into a library #
For simplicity in styling here I am going to use Mapbox GL, but we could easily be using the Esri JavaScript API, OpenLayers or potentially even Leaflet (with the right plugin). Basically any library which supports Vector Tiles.
Here is how we'd setup a map in JavaScript:
mapboxgl.accessToken =
  "pk.eyJ1IjoiamFtZXNtaWxuZXIiLCJhIjoiY2prNzA2aGprMWt0MTNydGhuMWs3NG13NSJ9.hRj9NRx4ROa0QDkT4t9XdQ";
var map = new mapboxgl.Map({
  container: "map",
  style: "zoomstack.json",
});
For styling purposes I took the a premade style from the Ordnance Survey styling repository. You can just download to the root directory where your index.html is and save it with a sensible name as .json file. You will need to make some adjustments to the original OS styling file to make it work with our new setup, such as change the tile url to be the new tiles API format like so:
	"composite": {
		"tiles": [
			"http://127.0.0.1:8080/tiles/pbftiles/{z}/{x}/{y}.pbf"
		],
		"type": "vector"
	}
Using sprites locally #
You can download the sprites from the Ordnance Survey folder Mapbox GL styles folder on GitHub, place them locally for your web server to pick up. You can reference them in your style json like so:
"sprite": "http://127.0.0.1:8080/sprites/sprites",Custom Fonts #
Custom glpyhs can be provided to your styling file to add flair to your map. Let's say you have a font tha you like from a provider like Google Fonts and then use those with your tiles. You can do this by downloading a fonts ttf file and then running it through fontnik. You can install fontnik locally using npm (npm install fontnik) and then run the build-glyphs in the node_modules folder for fontnik. For example let's say we downloaded the Roboto TTF file, we can build those glyphs using:
mkdir fonts/Roboto\ Regular
node_modules/fontnik/bin/build-glyphs path/to/source/Roboto-Regular.ttf path/to/fonts/Roboto\ Regular
Note escaping the spaces in the path names using the backslash. After this you can edit your style file to provide the web server glyph URL like so:
"glyphs": "http://127.0.0.1:8080/path/to/fonts/{fontstack}/{range}.pbf",Then in a layer layout property you could defined font-text like this:
	"text-font": [
		"Roboto Regular"
	]
Custom styling using Maputnik #
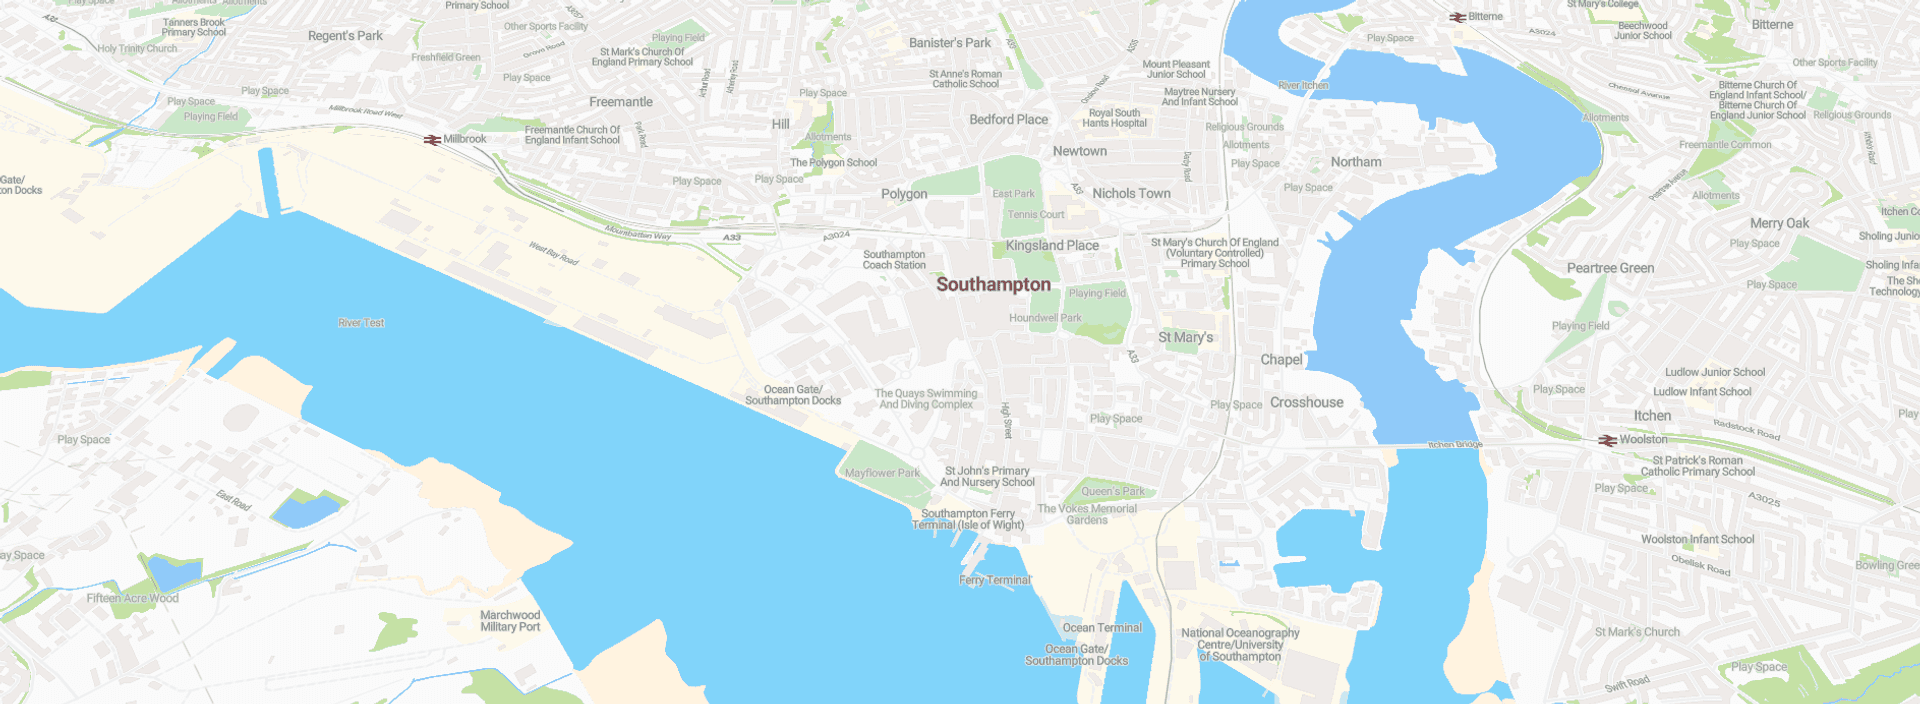
Maputnik provides a GUI styling tool you can use to create your own custom styles. You can load your local style (zoomstack-json for example) right into Maputnik and making edits. Check it out at https://maputnik.github.io/editor. Here's an example of a little styling I did using Material Design based colours and fonts:
Conclusion #
Using the .mtiles file you can generate you own tiles to play around with. You could use these locally or host them somewhere on the web like an Amazon S3 bucket, or a web server of your choosing. You'll want to figure out how to serve the compressed files for best performance. You can also use fantastic base stylings from Ordnance Survey as starting points for your own custom styling for the maps, and edit them manually using a text editor or using a GUI like Maputnik.
Published