Using Go to Plot Global Data
Wanting to explore more around geospatial tools with Go, this week I've been exploring Globe. Globe creates wireframe global visualisations of data sets, provided they contain latitude and longitude points. Here's an example of the API from the README:
    shops, err := LoadCoffeeShops("./starbucks.json")
    if err != nil {
        log.Fatal(err)
    }

    green := color.NRGBA{0x00, 0x64, 0x3c, 192}
    g := globe.New()
    g.DrawGraticule(10.0)
    for _, s := range shops {
        g.DrawDot(s.Lat, s.Lng, 0.05, globe.Color(green))
    }
    g.CenterOn(40.645423, -73.903879)
    err = g.SavePNG("starbucks.png", 400)
    if err != nil {
        log.Fatal(err)
    }
I decided that I wanted to build a web service that would allow users to generate an image (PNG) using some sort of interface. With a few free evenings I got to work!
The Backend #
For all request serving activity I used the built in http package. Go has a fantastic standard library for building web apps. However I did find it a little tough to find sensible examples of file upload handling.
For extracting the geospatial elements of the data, I used Paul Mach's GeoJSON package for extracting latitude and longitudes from GeoJSON and then used the standard library CSV package for the doing the same operation with CSVs.
Finally for the drawing; we use the aforementioned Globe package to do the actual drawing. This was all relatively straightforward minus hitting one issue around trying to use RGBA colors rather than NRGBA (non-alpha-premultiplied 32-bit color) colors with the library. It turns out NRGBA produces a lot cleaner results, you can see the issue on the Globe package here.
The app is hosted on Heroku. It took me a little while to get to grips with deploying Go apps on the platform (leveraging Go's vendoring system was a first for me), but apart from that it was pretty painless. The GitHub push-to-deploy integration is also a very nice touch!
The Frontend #
The frontend uses jQuery (boooo) as a general DOM/request helper library. It would have been relatively straight forward to replace these with smaller modular libraries but I was feeling a tad on the lazy side (Pull Request anyone?). For the user interface we leverage Skeleton CSS for the layout.
Spectrum.js is used as the colour selector, which we pass to the backend to generate the dots. To get unique file names, I leveraged a UUID library that prevents clashes.
Lastly, and potentially most interestingly, we make use of Turf.js to find the centroid of the latitude/longitudes. For those of you who aren't familiar Turf.js is a geospatial analysis library for JavaScript, with a very powerful set of tools at its disposal for dealing with geometries. Mapbox's csv2geojson was also used to convert CSVs over to GeoJSON so that it can work alongside Turf.js (it uses GeoJSON as it's operating format). Overall I feel like this was a pretty nice solution as it allows for 'smart defaults' of the center of where the image is generated, without the user having to guess/analyse there data extensively.
Demo #
The service allows you to create images like this:
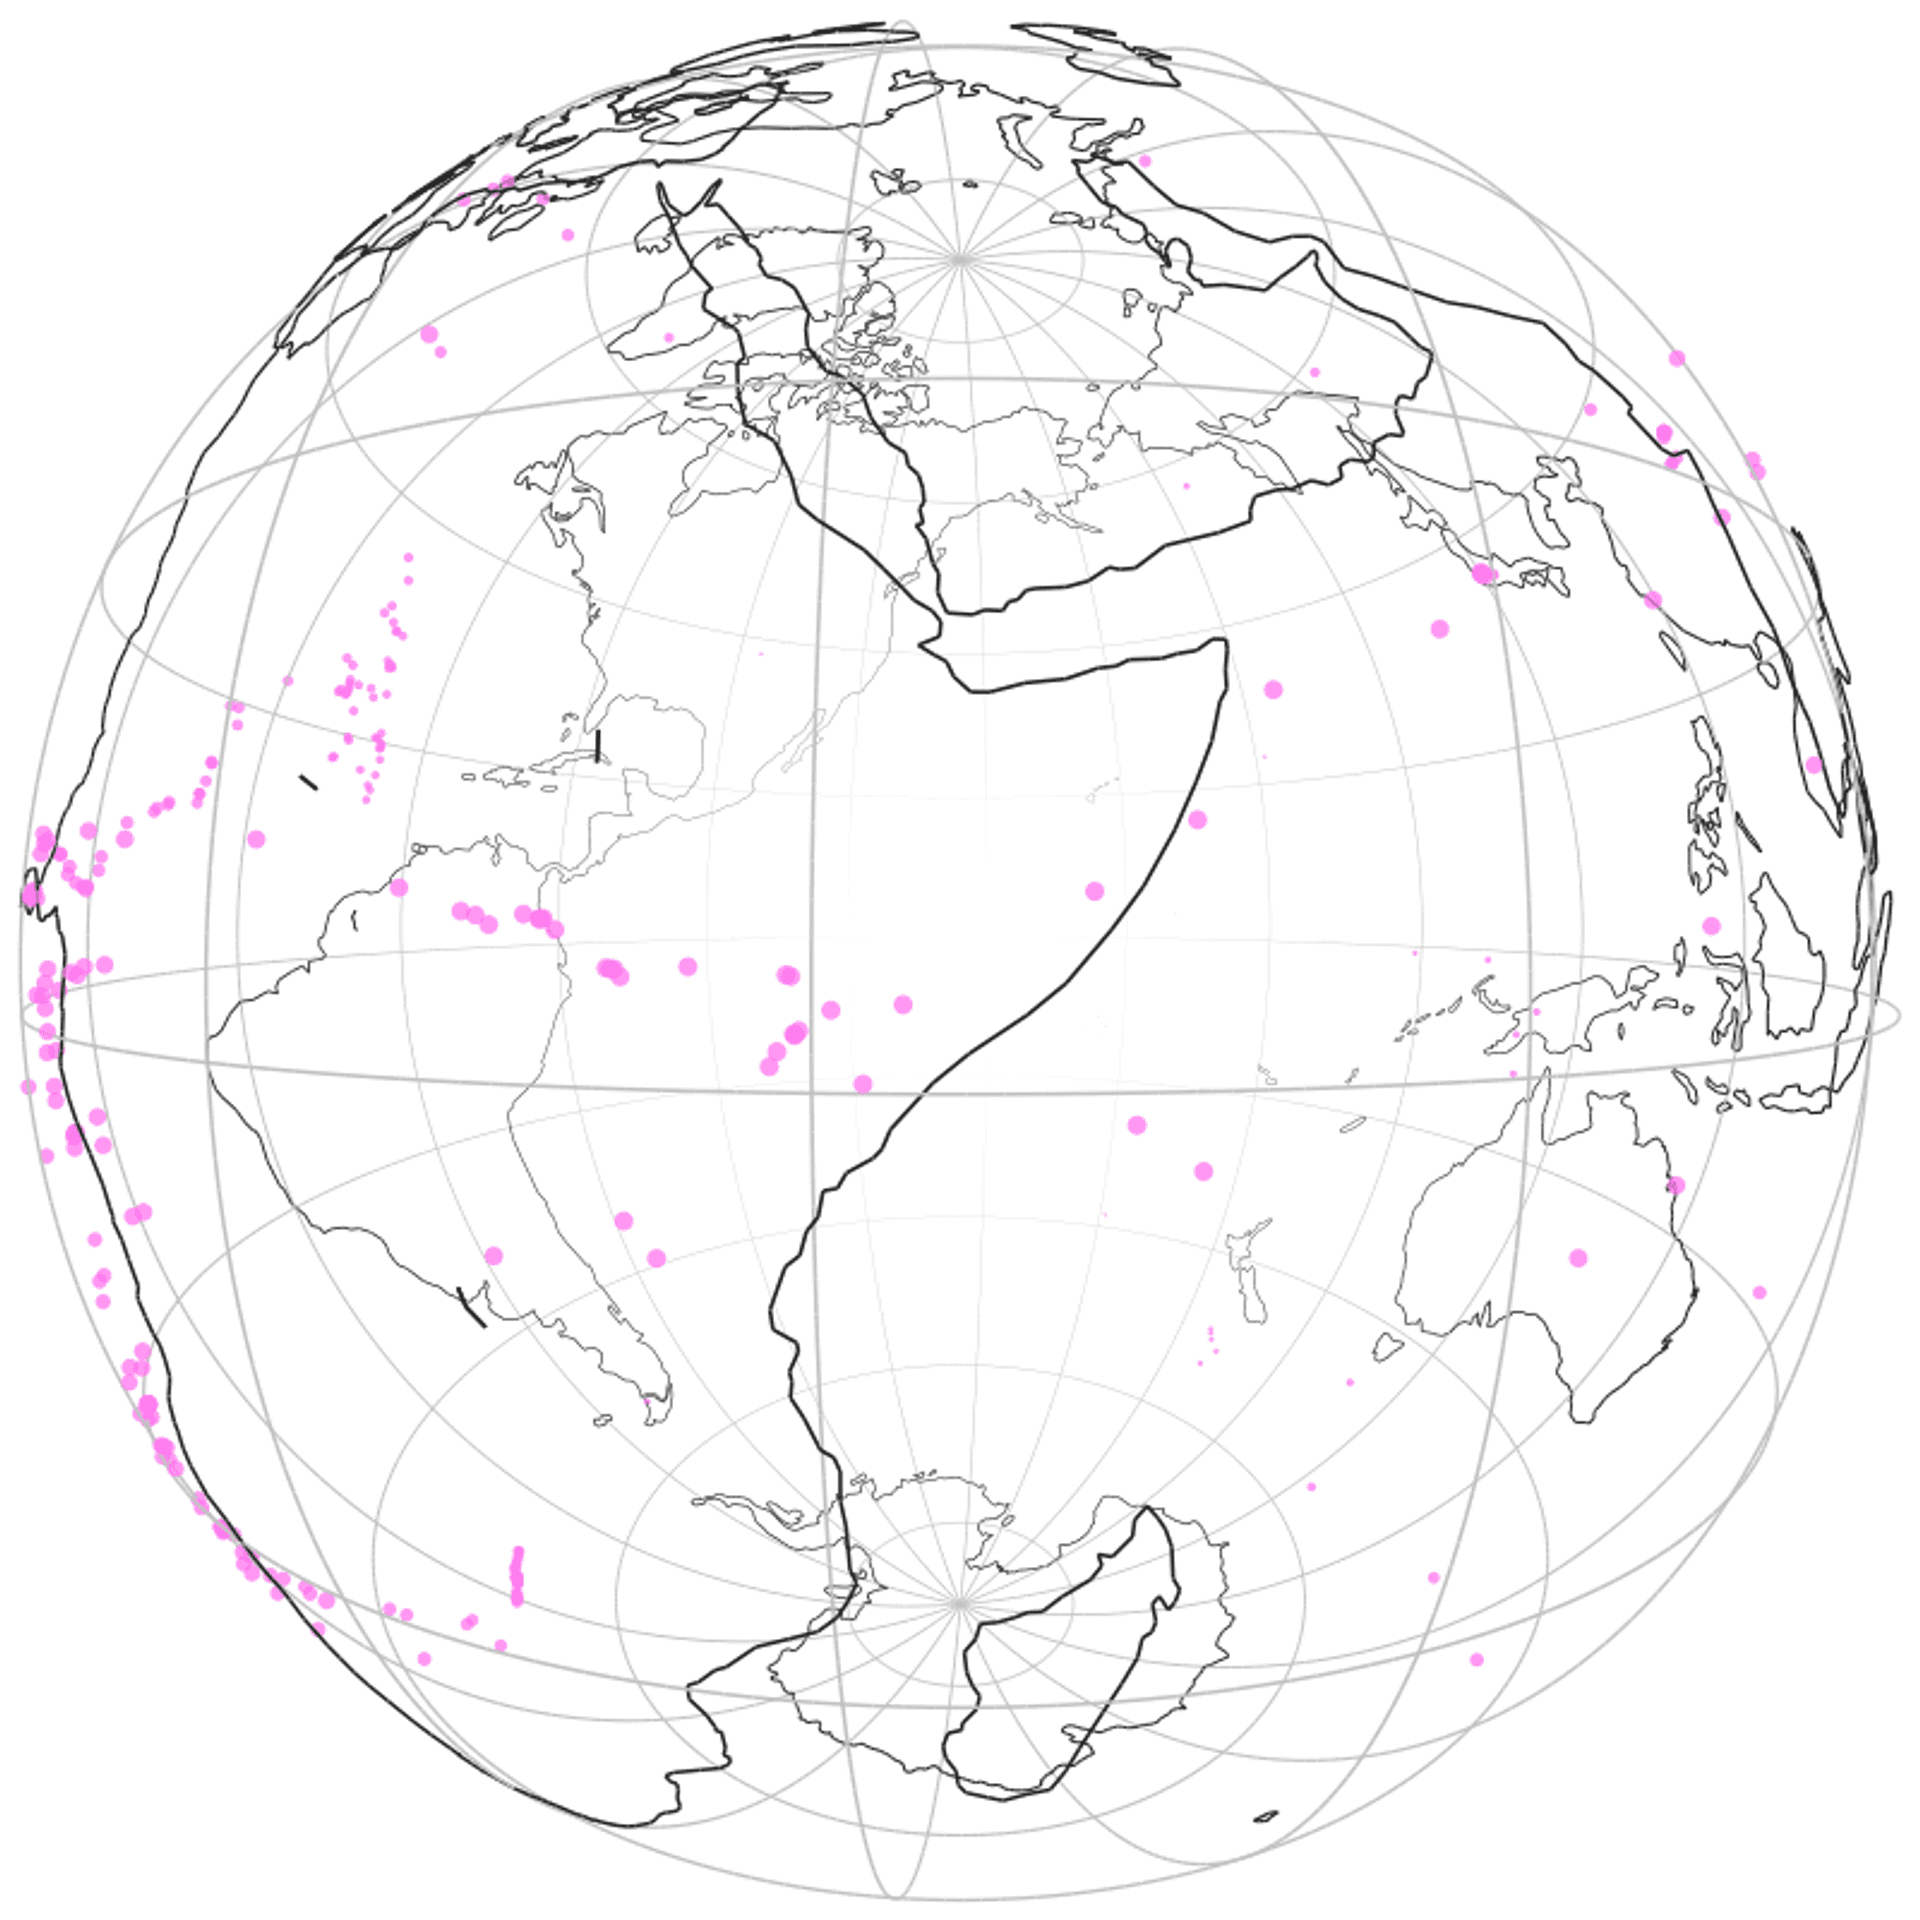
You can check out the app at https://globe-plotter.herokuapp.com and have a little play. Try this earthquake GeoJSON file from the USGS if you're looking for and example.
Published