Debugging TypeScript Node Apps
This blog post will be a short overview of how you can use the Chrome Node inspector with TypeScript programs.
We'll assume here we have a basic program called index.ts. We'll need to kick off with setting up the Node debugger in Chrome. You can go to chrome://inspect/#devices, you'll see a link called Open dedicated DevTools for Node. This will open up a separate window with the Chrome Node debugger.
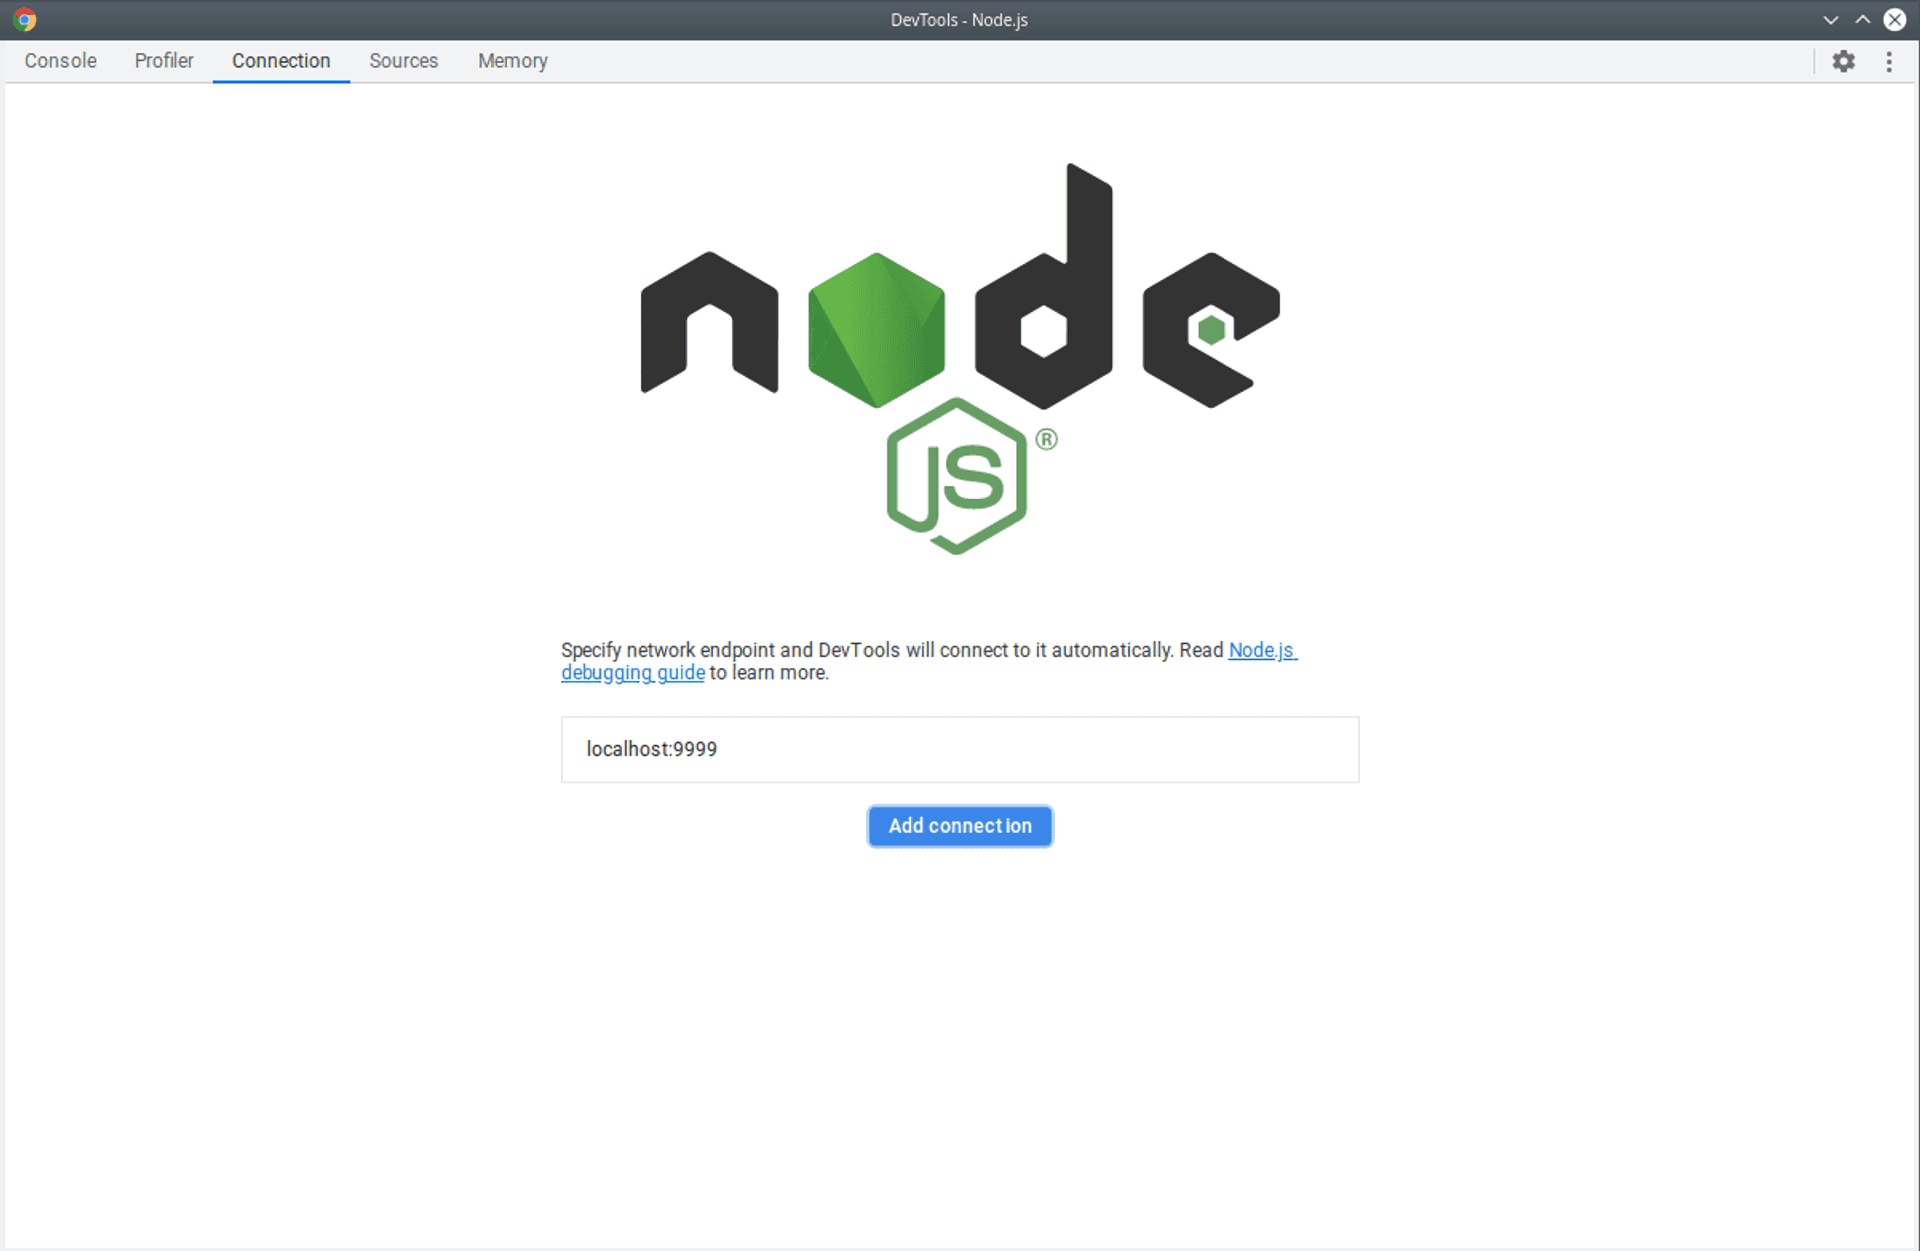
First I'll show you how to start straight away as your run the program. The port defaults at 9229 if you don't pass anything to inspect but I'll set the port to 9999 here. You will need to add localhost:9999 on the connection tab like so:
Once you're ready you can run your code with the debugger attached like this:
node --inspect=9999 --require ts-node/register index.tsIf you want the debugger to break on user code starting you can do like so:
node --inspect-brk=9999 --require ts-node/register index.tsYou get a tonne of useful features here in the debugger panels such as being able to see errors in the source code, putting in break points, seeing console logs, profiling the app and also heap snapshot inspection.
One issue I've noticed here is that the code only appears to be discovered when it is run. What I've found helpful is to put a debugger statement at the end of your code. You can do that like so:
import depOne from "./depOne";
console.log("Example ts-node debugging");
console.log(depOne);
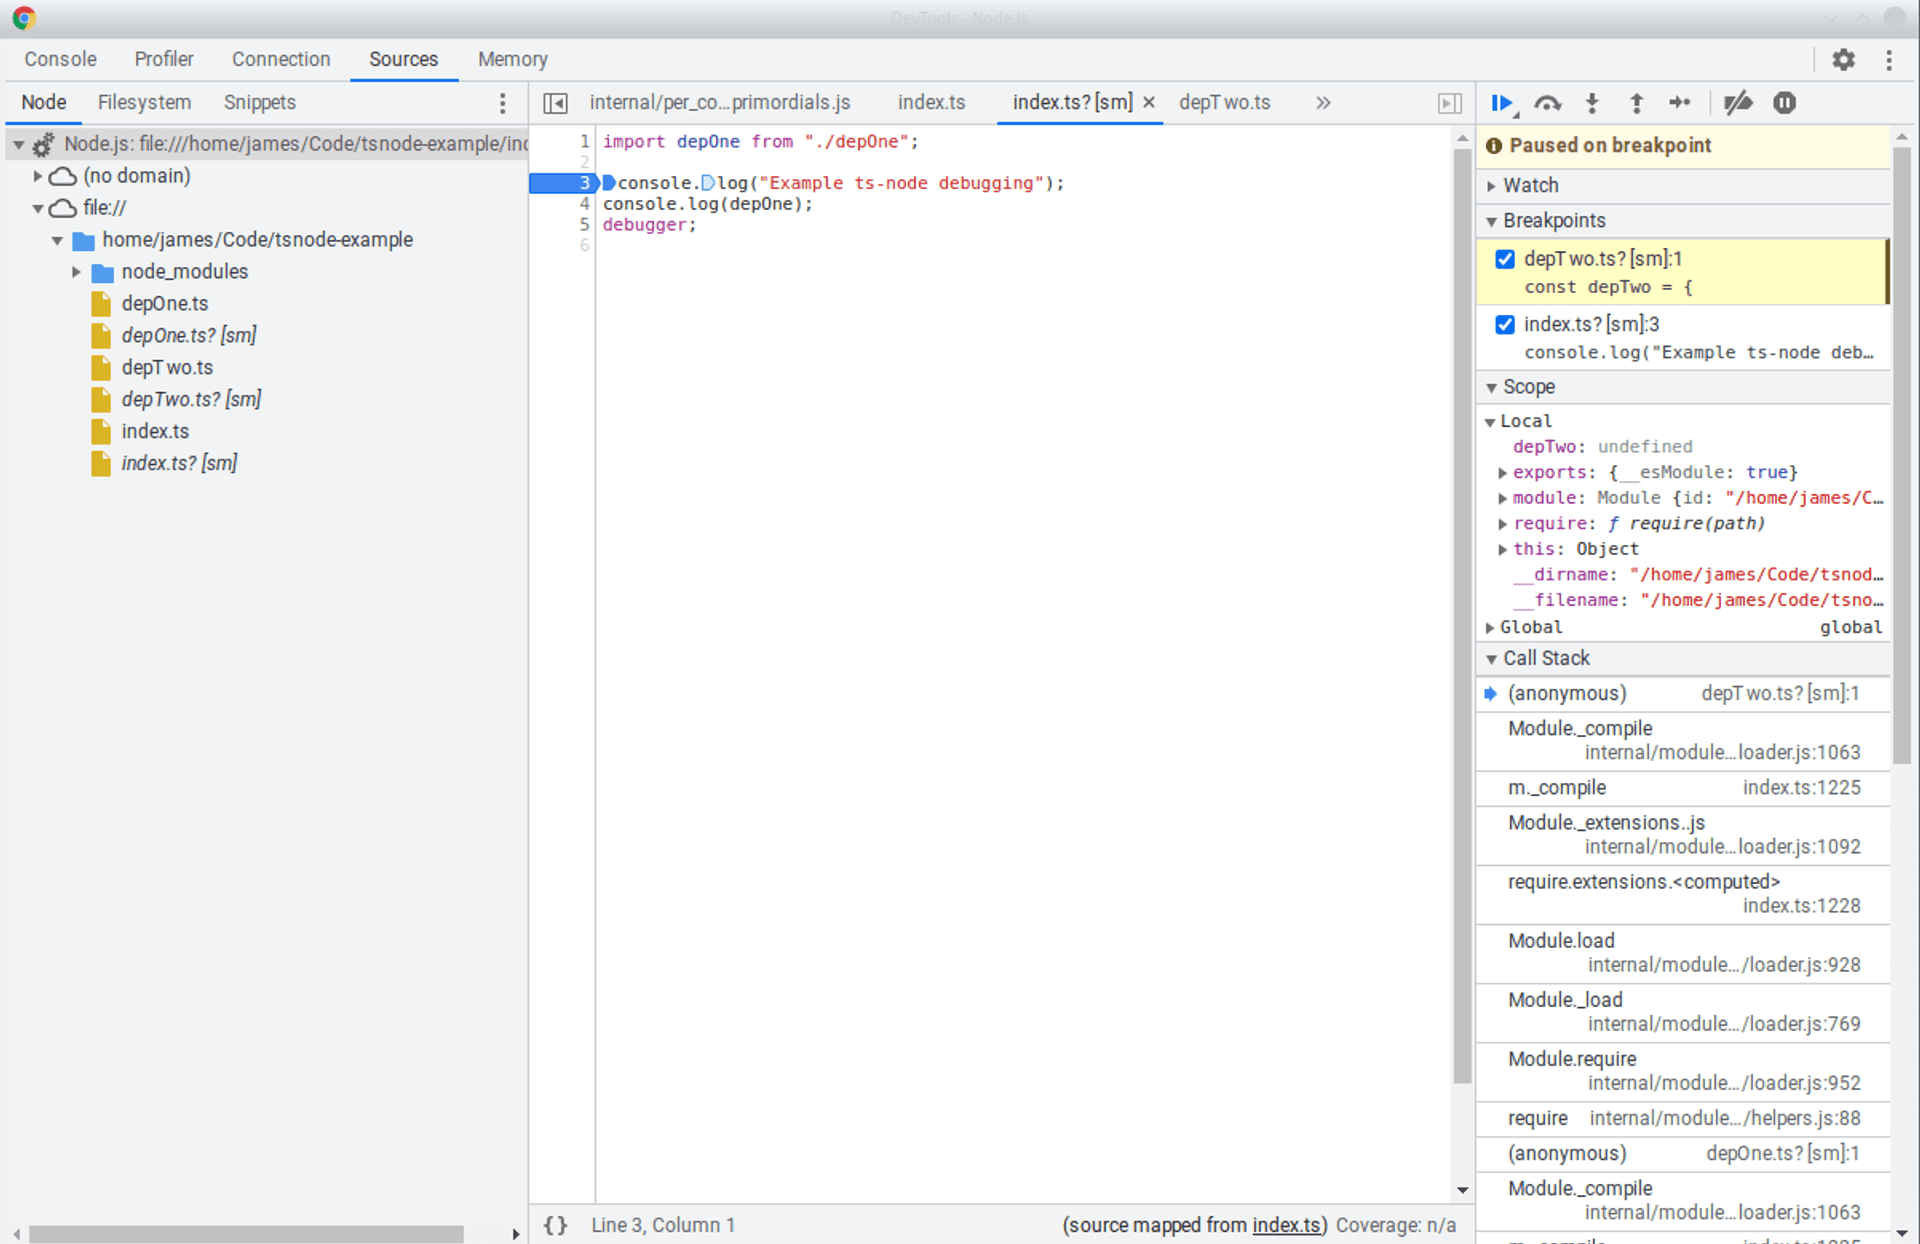
debugger;From here you can navigate the source files (you should see a source map and the relating compiled files) like in the following image:
For a more in-depth dive into the Node Debugger, I recommend checking out Paul Irish's talk at 2017 Node Summit.
Published