Big Geo Data, Spatial Indexes and Parallelization
As geospatial datasets continue to increase in size, the necessity to be able to query and gain meaning from them efficiently has never been more important. I have talked a little bit previously about why geospatial problems are inherently complex to solve (predominantly down to the multidimensional nature of the data). To demonstrate swiftly however, we can imagine that some years ago it would have been pretty normal to want to know which of 1000 points sit inside which of 100 polygons (e.g. Post Boxes in administrative boundaries for example). Overall computationally that's not too bad; if we went through sequentially and checked everything we'd be at 100000 operations, which although to us might sound like a lot, isn't too bad for a computer. However, what about if we were take take some large machine generated data (e.g. water height sensors), or mass social media (e.g. Twitter, Instagram etc) dataset instead? We are looking at 10s if not 100s of thousands of points in some circumstances. The sequential (bruteforce) approach is perhaps no longer so appealing.
Thankfully this is a well known problem, and the geospatial academic and industrial community has come up with (amongst other things) spatial indexes. Spatial indexes organise data into structures that can quickly be traversed to get access to the underlying geographic data in an efficient fashion. Common indexes for spatial data include things such as Quadtrees, R-trees, Geohashes and Space Filling Curves (e.g. Z order, Hilbert Curves), some of which you may have heard of. In Big O terms (a concept I touched on in my previous post) the reduction in complexity can be significant.
For example finding a object in a Quadtree is on average a O(log n) operation (Finkel and Bentley, 1974), compared to a O(n) operation for sequential searching. That is to say as we traverse down the Quadtree through each the quads to find the object it will take log4 * n time. Quadtrees are a popular spatial indexing method and one the first spatial data structures (de Berg, 2008), and are used a fair amount for range (bounding box) searching in various fields including GIS. The approach with a Quadtree is to recursively divide the geometric space into quadtrants (4). This happens continuously until there are no more points in any of the quads. This is demonstrated here:
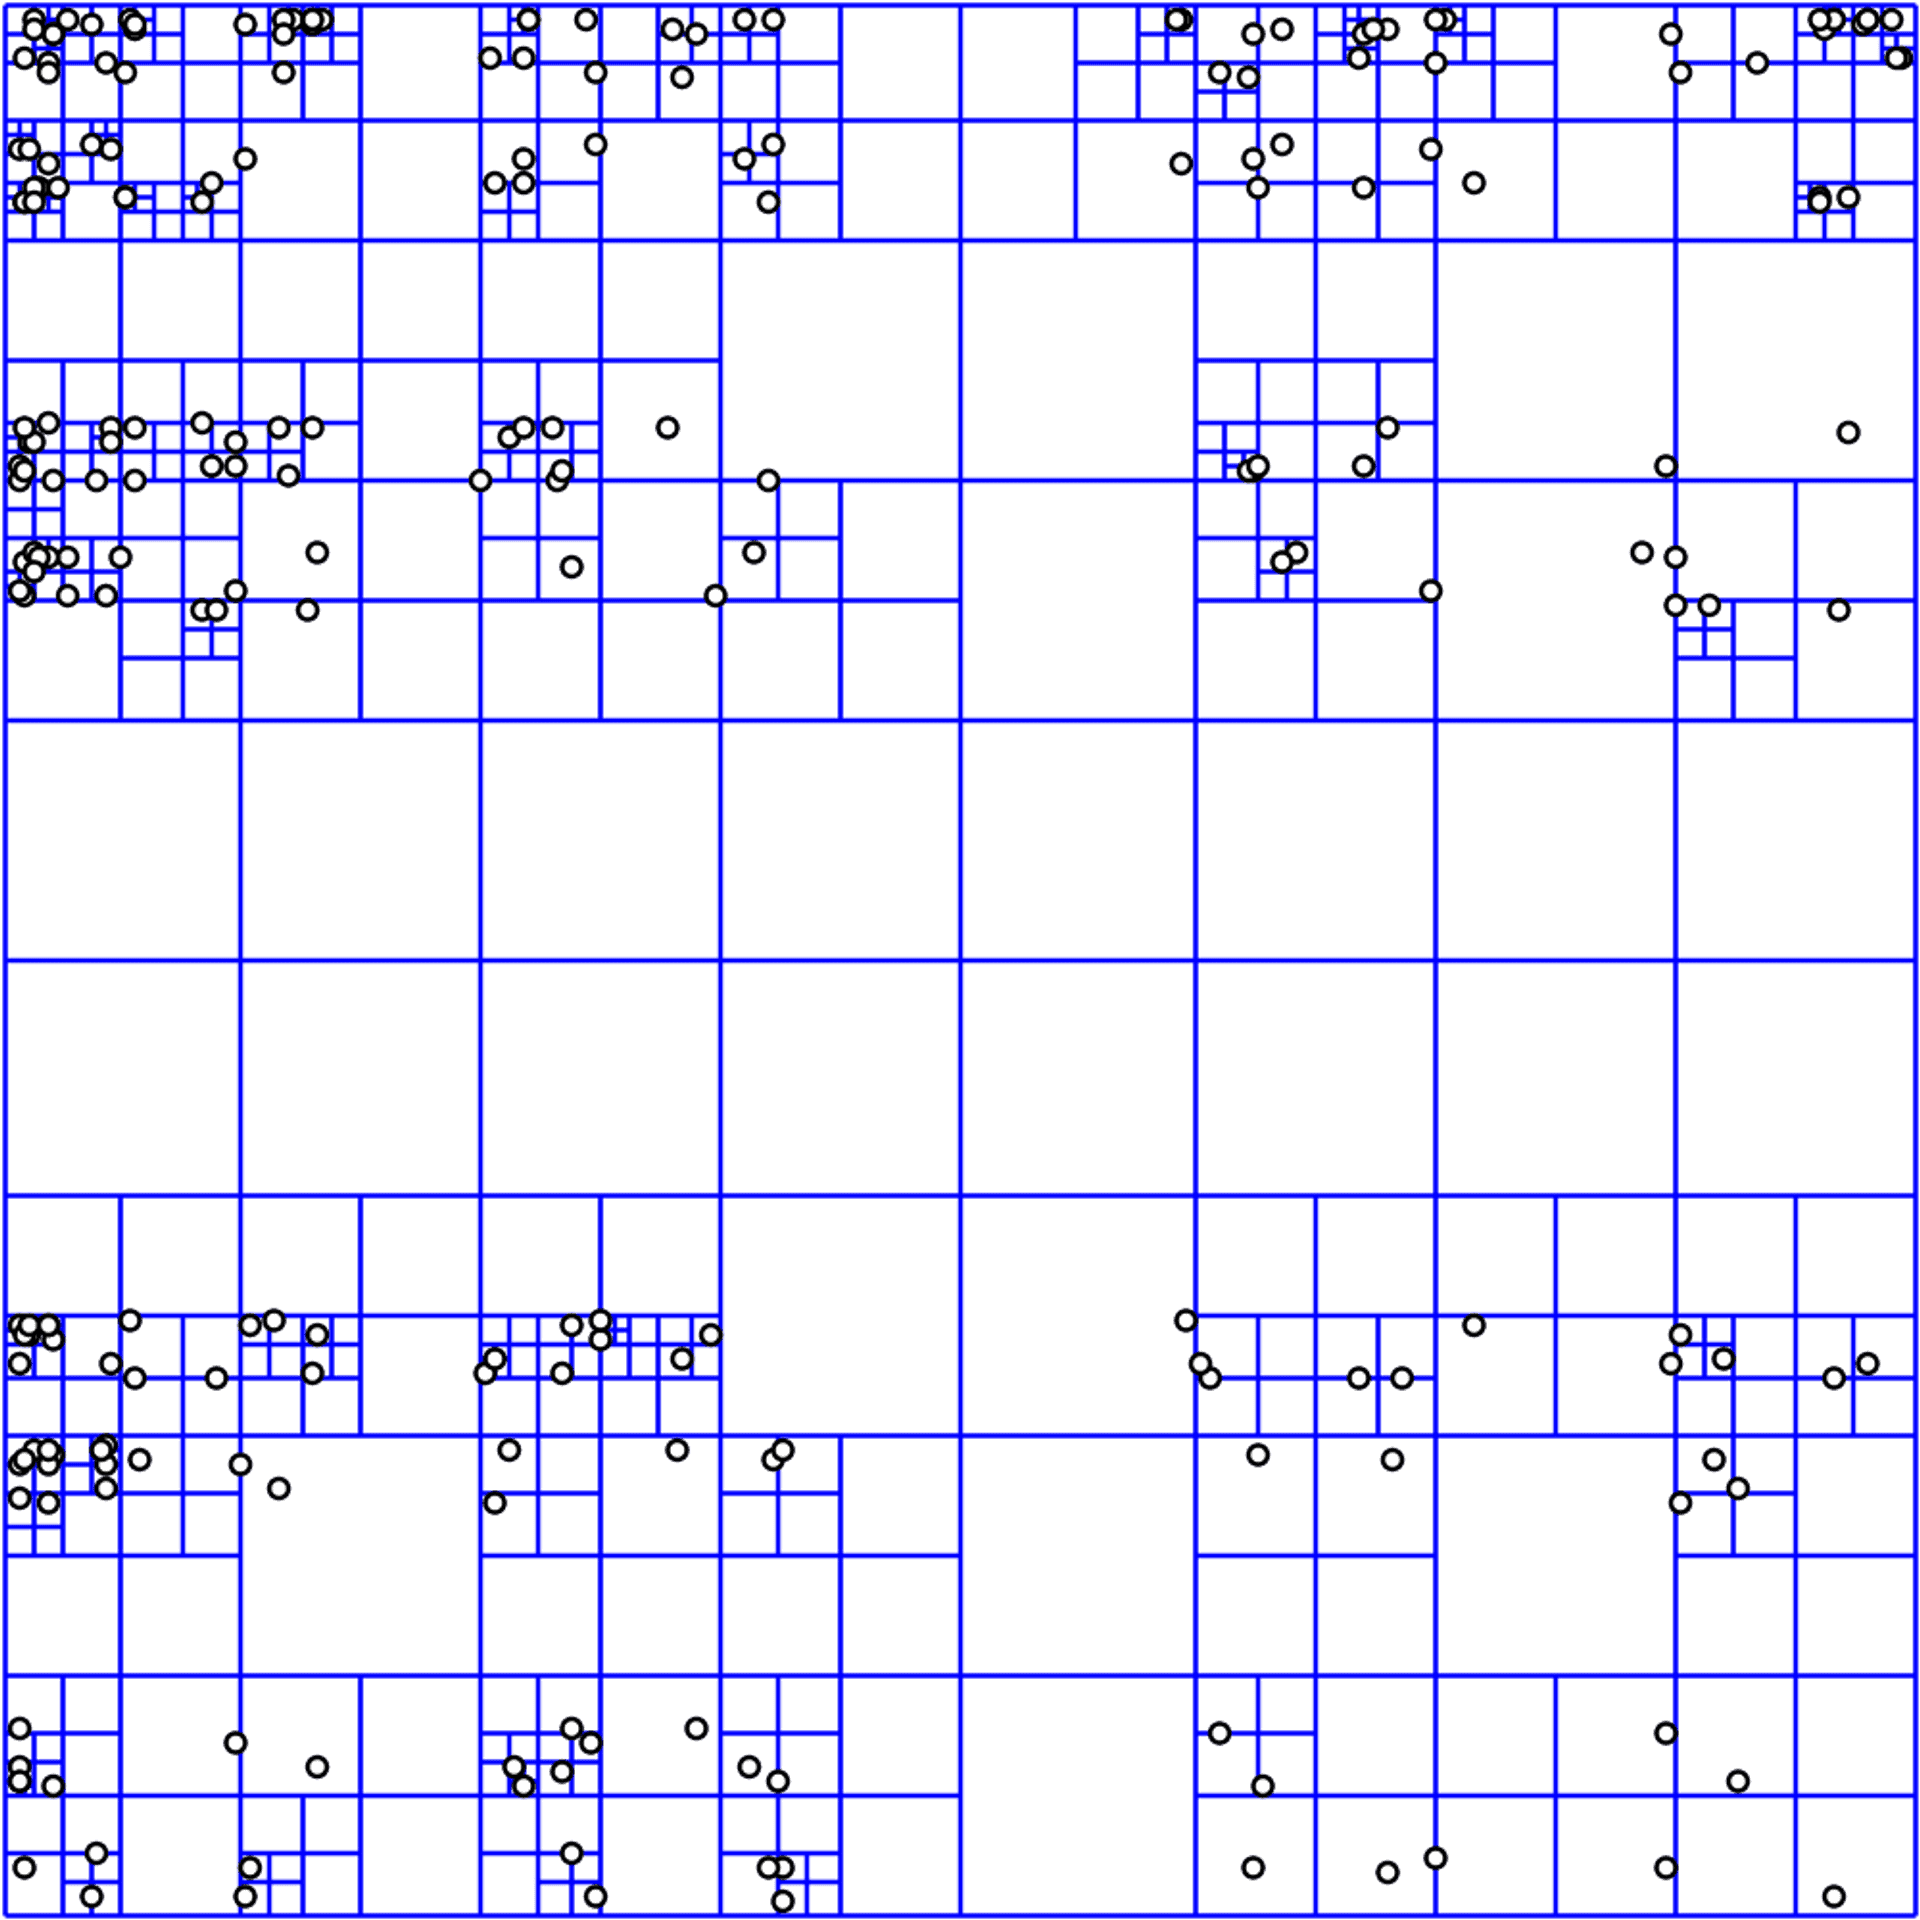
Taking the quadtree example further, lets discuss how this data structure helps us perform a spatial query. Let's say we have a large set of points and we want to see if we draw some arbitrary bounding box which points are contained within that box (it could be postboxes around the UK for example). We start at the top of the Quadtree tree structure checking which quadrant(s) intersect the bounding box, and we continuously work down the the tree until we reach the final points within the child quadrants. We then check if that point actually resides within the box specified. This speeds up the search, as we only need to check quadrants that intersect the bounding box, reducing the number of points we need to check for containment drastically. This is in comparison to checking all points for containment within the bounding box sequentially. For a more practical example how indexing speeds up query, check out Nicholas Duggan's post entitled 'Why Spatial Indexing is Really Important' which covers speedups provided in PostGIS through indexing.
Lets take the previous Quadtree problem statement around bounding box searching and take a look at a practical JavaScript implementation, in this case in the form of an interactive example from Mike Bostock. As you can see the app is pretty performant and helps demonstrate visually the benefit of a Quadtree data structure for spatial data.
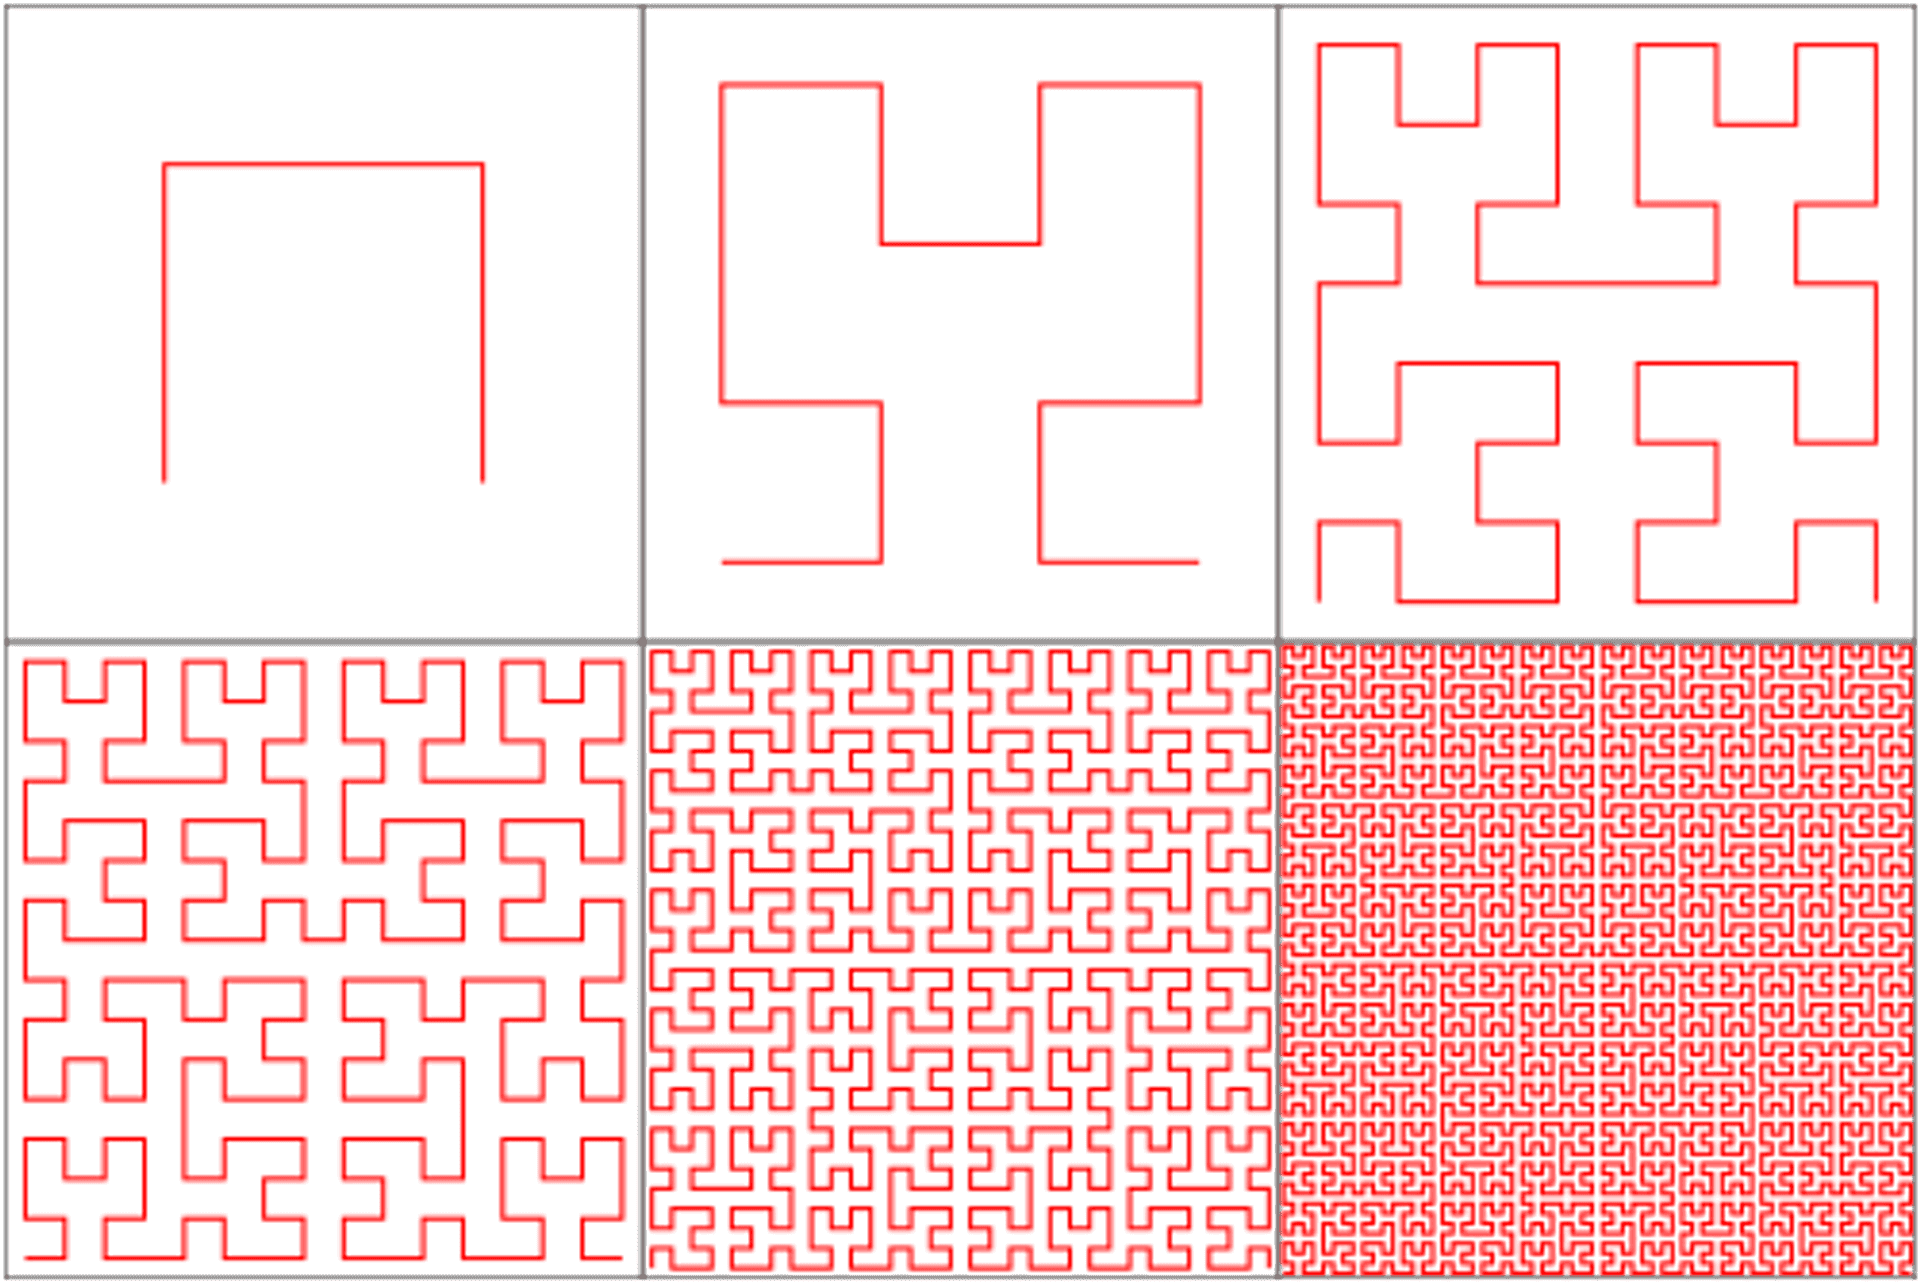
Another innovative approach to indexing is to use what is termed a 'space filling curve'. A space filling curve (SFC) allows you to represent 2D or 3D space as a single one dimensional line that 'curves' (more like snakes!) around the space. This requires passing a continuous line through a (imaginary) finite resolution grid over the geometric space. Generally the line does this in a fractal like pattern, that is to say it recursively looks the same as you get closer and further away from the curve. Sounds crazy right? Well when this is performed it allows us (albeit not perfectly) to maintain locality in a one dimensional data structure. By locality we mean points close together in our 1D data structure (such as an array) are relatively close together in 2D or 3D space. However, inevitably they will never be exact and there will be times where x,y coordinates are close but there position in the 1 dimensional array are far apart (Mishra, 2011). Some examples of space filling curves include: Hilbert Curve, Peano Curve and the Z Order Curve. Here's an example of a Hilbert Curve:
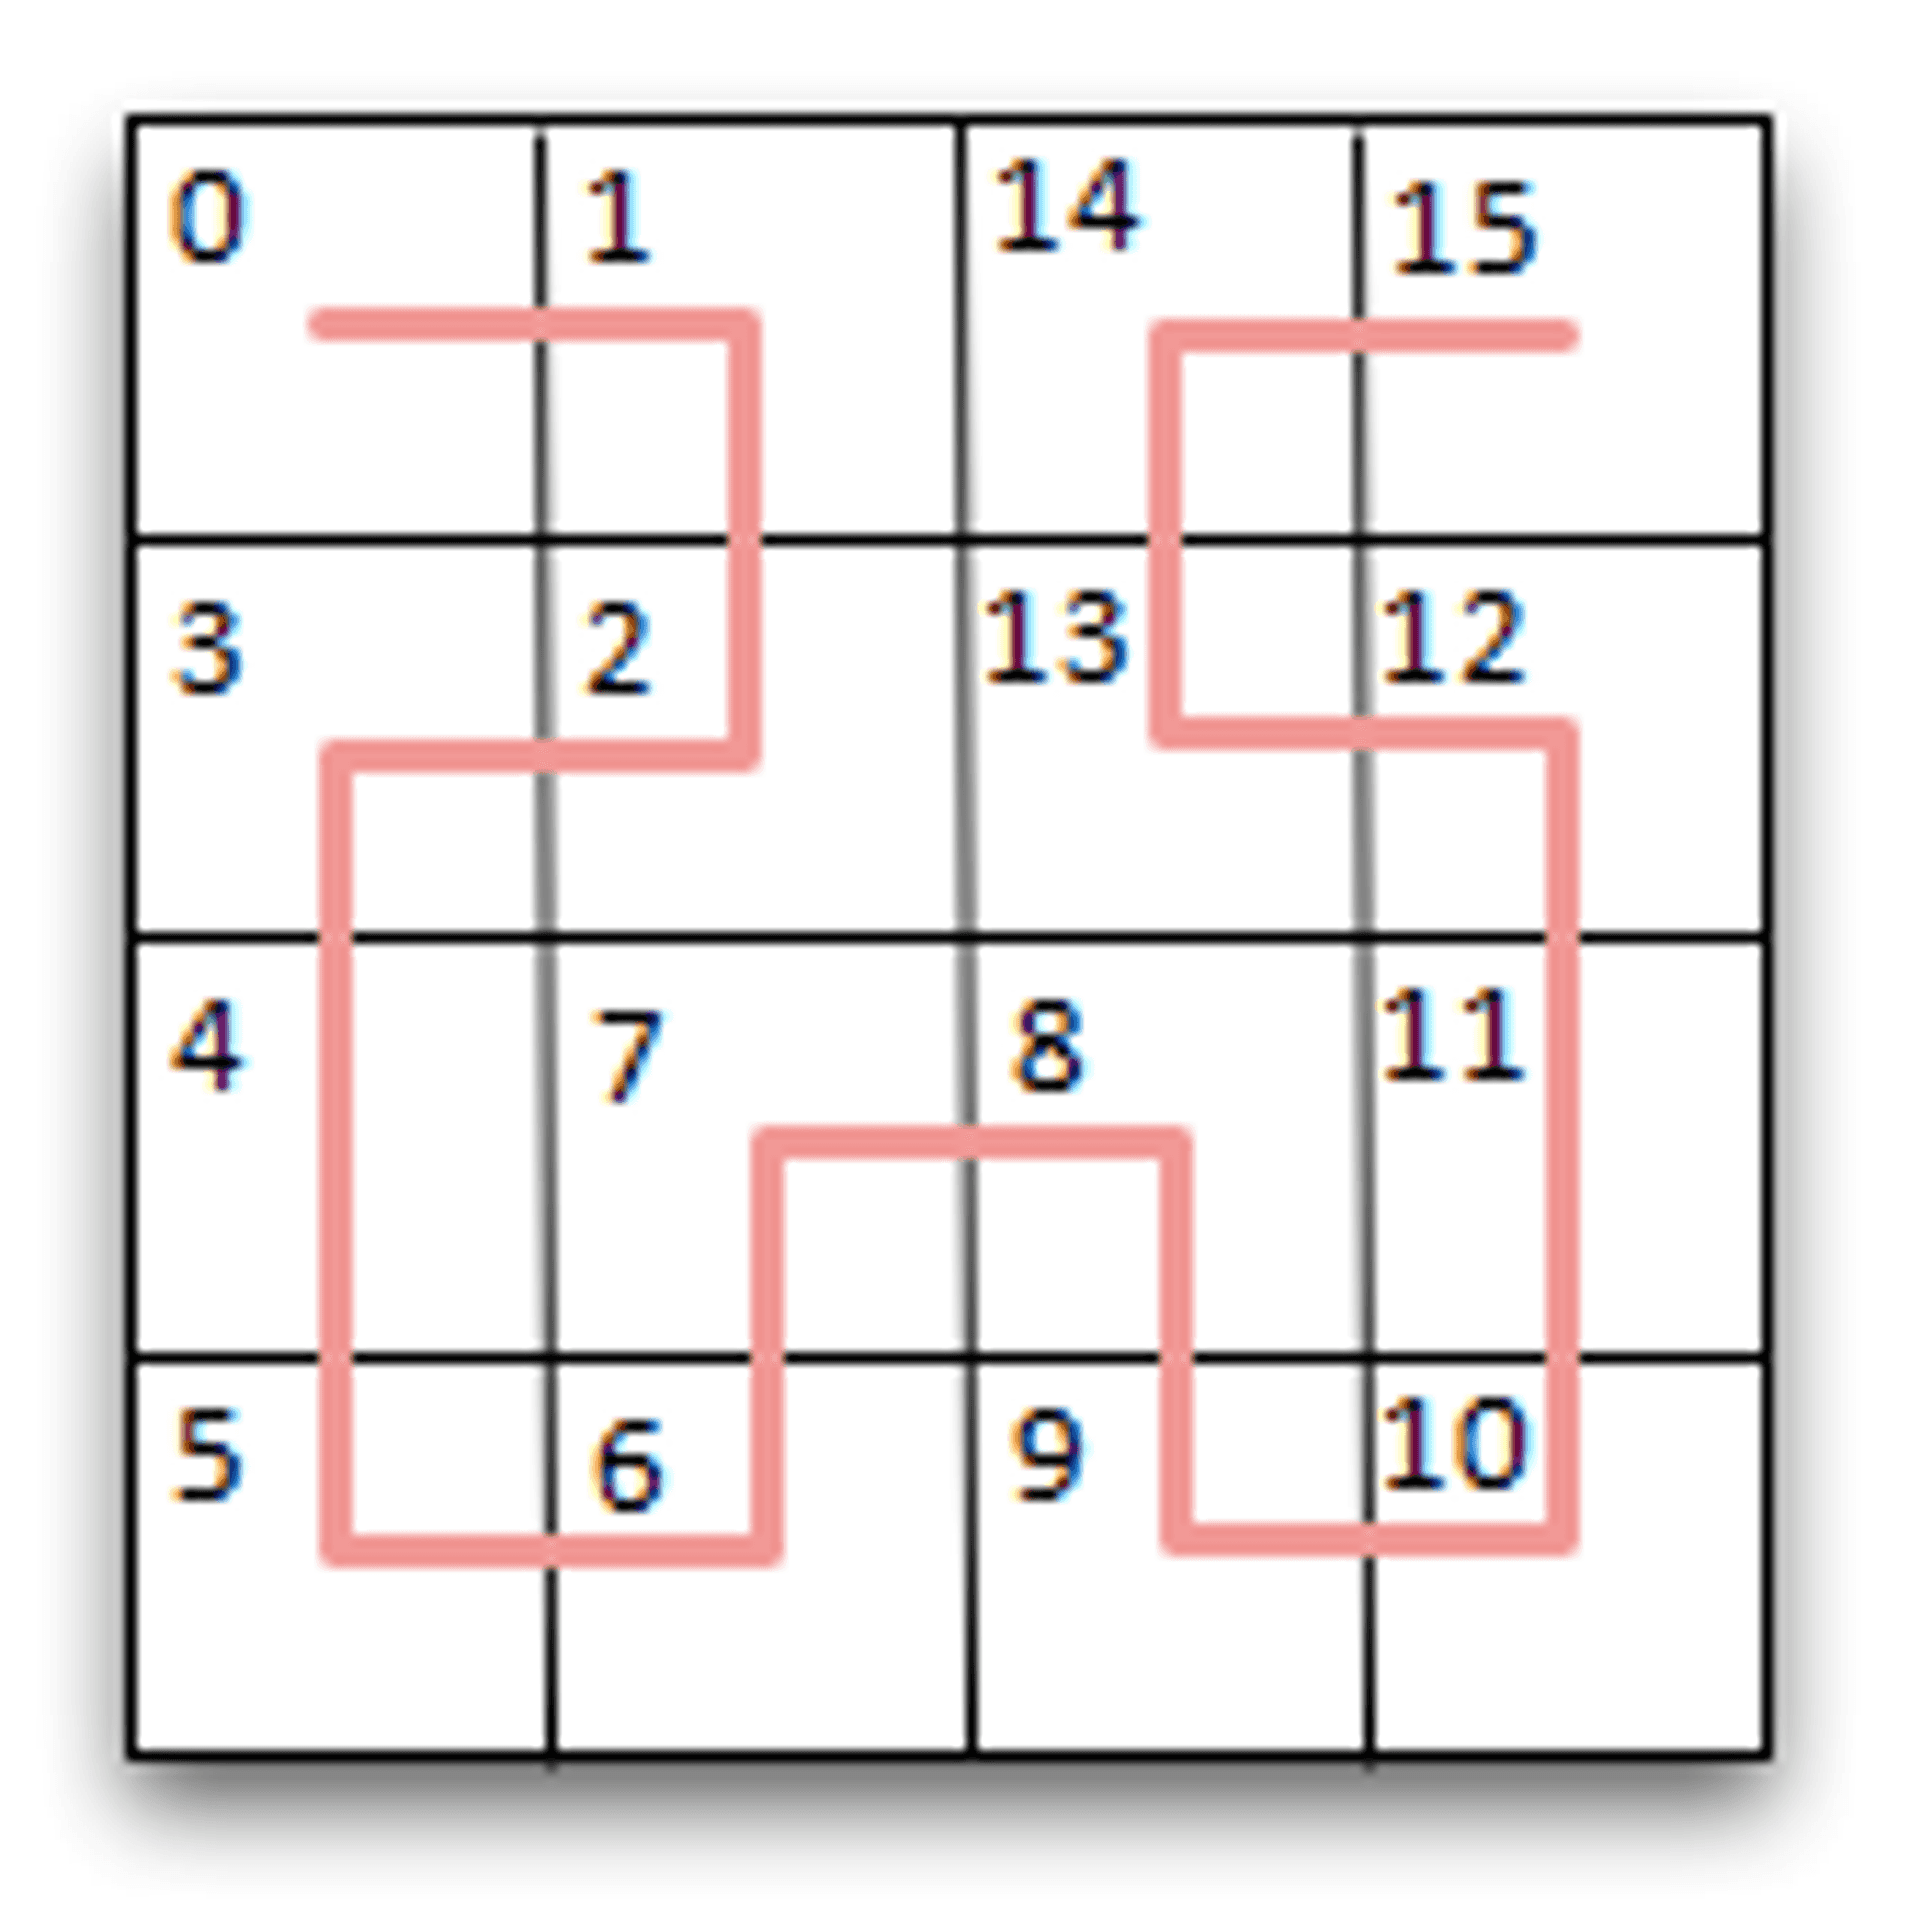
If you imagine, we could label each block sequentially (1, 2, 3, 4 etc, although normally in binary) and stretch it out to get a one dimensional data structure. Now lets take a look at how we could use a space filling curve for a our advantage for a range query. We can take our one dimensional data structure and index this also using something like a B+tree. Having done that we can take all the curve points (blocks) that sit underneath a given queries bounding box. From here we can take the curve points, say for example points (blocks) 4-9, and query the B+tree index taking the pointer to the underlying object and finally verifying this actually sits within the bounding box (Dai, 2011). As you can see, perhaps not the easiest concept in the world to explain, but hopefully using the following example from Jared Winick you can begin to understand visually how the search works. It's important to know Winick's example uses a Z Order Curve , not a Hilbert Curve as depicted above (the Z curve is more... z shaped).
There are a fair few open source implementations of Space Filling Curves for dealing with large spatial datasets, one from Google called Uzaygezen (not maintained to my knowledge) and another called SFCurve from LocationTech (currently experimental). The Z-order curve can be used BigTable-like systems such as HBase, Cassandra and Accumulo (which Geomesa is based off) to get a bounding box query from Z-order curve index for range scanning (bounding box searching).
If you are struggling with the Space Filling Curve concept, I thoroughly recommend this (somewhat ancient!) video regarding the subject:
Lastly, what of parallelization? That is to say can we distribute processing for intense geospatial queries across multiple machines or processing cores? We have already identified in the previous blog post, that the reason geo queries are so hard to parallelize is the intrinsic necessity for locality to be maintained whilst splitting data. That is to say, we cant just split up and data in any old fashion to have it processed, as the location of the data is an integral part of the processing/querying:
"The items of ordinary commercial databases are generally isolated and lack explicit relationships; while for spatial data there are many associations, such as topological relationships, directional relationships, and metrical relationships, which should be taken into full account when the spatial data is partitioned" - Meng et al. (2007)
Luckily space filling curves and other spatial indexing methods have allowed us to split data up in ways that maintain locality, therefore maintaining relationships that are necessary in topological and geometric operations. In more academic terms:
"The big spatial data are partitioned into blocks according to the geographic space and block size threshold 1, and these blocks are uniformly distributed on cluster nodes. Then the geographically adjacent spatial objects are stored sequentially in terms of space filling curve which could preserve the geographic proximity of spatial objects." - Zhang et al (n.d.)
Indeed, here we can illustrate that not only do spatial indexes allow us to greatly speed up spatial querying, but also allow us to parallelize data across nodes for operations such as MapReduce!
I know that's been a lot to take in, but hopefully that's helped illustrate something that's I've been trying to get my head round recently. I'd be really interested in hearing your thoughts, comments and even corrections (I always want to learn more!).
Published